
The ABC's of Quadratic Equations
An Exploration of the xa, xb, and xc Planes
by
Sarah Major
This write-up is based on Exploration 3 in which we are prompt to look the various relationships of x with the values of b and c from the following equation:
![]()
In particular, we are asked to view graphs in the xb and xc planes and note any relationships. In this write-up, I will first analyze graphs in the xb plane following by the xc plane. Afterwards, I will add the coefficient a to produce the following equation:
![]()
Using this equation, I will then analyze graphs in the xa plane.
First, I will analyze graphs in the xb plane. For the sake of focusing on values of b, I will pick an arbitrary value for c so that b is the only unknown. After analyzing the graphs, I will then pick another value for c to make sure the results are repeatable for multiple values of c. For simplicity in the first analysis, I will choose c = 1 to produce the following equation:
![]()
Before delving into graphs in terms of b and x, let's graph this initial equation, set equal to y instead of 0, and note what the roots of this equation are for particular values of b (in essence, where the equation is equal to 0). I have chose to use b = -5, -3, 3, and 5. My choice for these values will become clear later on in the analysis. Here are the graphs:


We can find where the graphs equal 0 by finding the roots of each corresponding equation (note that values are approximate to two decimal places):
For b = -5, the roots are x = 0.21 and 4.79.
For b = -3, the roots are x = 0.38 and 2.62.
For b = 3, the roots are x = -2.62 and -0.38.
For b = 5, the roots are x = -4.79 and -0.21.
These values will come into play later on in the analysis.
I then need to solve the previous equation for b, since I will be graphing in the xb plane:
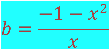
I then graph this equation in the xb plane:

What does this graph tell us? In essence, this graph tells us what the values for x and b we can have for these particular equations when c is 1. Because the domain goes from negative infinity to 0 and 0 to infinity (not including 0), x can be any value but 0 because this would cause the equation to be inconsistent (a statement that would say 1 = 0, which is not true). Since the range is negative infinity to -2 and 2 to infinity, b can be any values except the values appearing between -2 and 2. This makes sense because having these values would result in the graph of the equation not crossing the x-axis, and thus, the observations occurring later on in this analysis. This will become clear in the next section.
Let's graph the values of b that we used previously along with the equation we just graphed:


Notice that the graphs of each line intersect the original graph in two places. These are the values at which they intersect:
For b = -5, the graphs intersect at x = 0.21 and 4.79.
For b = -3, the graphs intersect at x = 0.38 and 2.62.
For b = 3, the graphs intersect at x = -2.62 and -0.38.
For b = 5, the graphs intersect at x = -4.79 and -0.21.
These are the exact values of the roots from the original equation.
Will this work if we change the value of c from 1 to another value? Let's do a test to find out.
Say c = 5 and b = 5. Let's graph the equation then:

The roots of this equation are x = -3.62 and -1.38.
Let's graph in the xb plane along with our value of b:

Where do the graphs intersect? x = -3.62 and -1.38.
Therefore, this does work for different values of c.
Next, we will analyze graphs in the xc plane. We once again start with the following original equation:
![]()
Once again, we will analyze the graphs of the original equations before we go into an analysis of c. Similar to the previous analysis, we will have b = 1, but for the values of c, we will use -5, -3, and -1. Once again, this decision will be clear momentarily:


What are the roots for these equations?
For c = -5, the roots are x = -2.79 and 1.79.
For c = -3, the roots are x = -2.30 and 1.30.
For c = -1, the roots are x = -1.62 and 0.62.
We then solve our original equation for c:
![]()
And then graph this on the xc plane along with our values of c:

This graph shows us that for these particular types of quadratic equations where b is 1, x can be any value from negative infinity to infinity. However, the values of c are restricted to the range of negative infinity to 0.25 for the equations to have roots.
What are the values at the intersections?
For c = -5, the graphs intersect at x = -2.79 and 1.79.
For c = -3, the graphs intersect at x = -2.30 and 1.30.
For c = -1, the graphs intersect at x = -1.62 and 0.62.
So, like for the xb plane, the intersections in the xc plane are an indicator of the roots for the original equations.
Now, we will add an a to the equation and then make observations about the xa plane. We begin with the following equation:
![]()
Similar to the previous two analyses, I will set the two values that are not in question, b and c, equal to 1. I will also use the values of -5, -3, and -1 for a. My choice for these values will be clear later. Let's graph these equations:


What are the roots of these equations?
For a = -5, the roots are x = -0.36 and 0.56.
For a = -3, the roots are x = -0.43 and 0.77.
For a = -1, the roots are x = -0.62 and 1.62.
We then solve our original equation for a:
![]()
And then graph this equation on our xa plane along with our values of a:

The graph shows that for these types of equations, when b = 1 and c = 1, x can equal any value but 0, as there is an asymptote where x = 0. As for the range of a, it can equal any value from negative infinity to 0.25, the range for which the equations would have roots.
What are the values at the intersections?
For a = -5, the graphs intersect at x = -0.36 and 0.56.
For a = -3, the graphs intersect at x = -0.43 and 0.77.